SSE companies' modest valuations signal growth potential


While the average price-to-earnings ratio of the companies listed at the Shanghai Stock Exchange came at 14.02 times by May 20, up 9 percent from that at the beginning of this year, the valuation of SSE companies is still at a lower level compared to their international corresponding trading venues, showing much room for growth for the SSE companies.
The above messages were delivered by the SSE in a report released at the end of May.
Data from the public domain showed the average PE of Nasdaq and the New York Stock Exchange in the United States was around 43.9 times and 20.37 times in late May, much higher than that of the SSE. The readings for the Tokyo Stock Exchange in Japan, the Korea Exchange and the Singapore Exchange reached 16.53 times, 20.2 times and 14.13 times, respectively, in late May. These have reflected the valuation resilience of the SSE companies, especially given the fact that China's economic fundamentals have been improving, said the SSE report.
Meanwhile, index-based products have taken shape on the Shanghai bourse, providing more liquidity to the market, said the SSE.
As of the end April, the total value of CSI index products amounted to 2 trillion yuan ($280 billion), up 19 percent from the beginning of the year. The total value of the products developed based on the benchmark Shanghai Composite Index exceeded 380 billion yuan, up 3.3 percent from the beginning of 2024.
Meanwhile, the technology-focused STAR Market at the SSE has seen 15 related indexes introduced, with nearly 160 billion yuan of domestic and foreign products launched based on these indexes. Among them, the combined product value of the STAR Market 100 ETF had approached 19 billion yuan by late May and surged nearly 40 percent from the issuance scale.
In 2023, the total operating income of 2,272 companies listed on the SSE was 51.85 trillion yuan. Their combined net profit attributable to the parent companies reached 4.3 trillion yuan, basically on par with the 2022 level.
It should be noted that 1,839 SSE companies, or 80 percent of all the companies trading at the Shanghai bourse, reported profits last year. Among them, 409 companies saw their income spike by more than 30 percent on a yearly basis and another 233 reported an annual income growth rate of over 50 percent.
The average annual compound growth rate of SSE companies' operating income was 7.34 percent over the past five years. Their CAGR of net profit attributable to the parent companies reached 7.27 percent over the past decade.
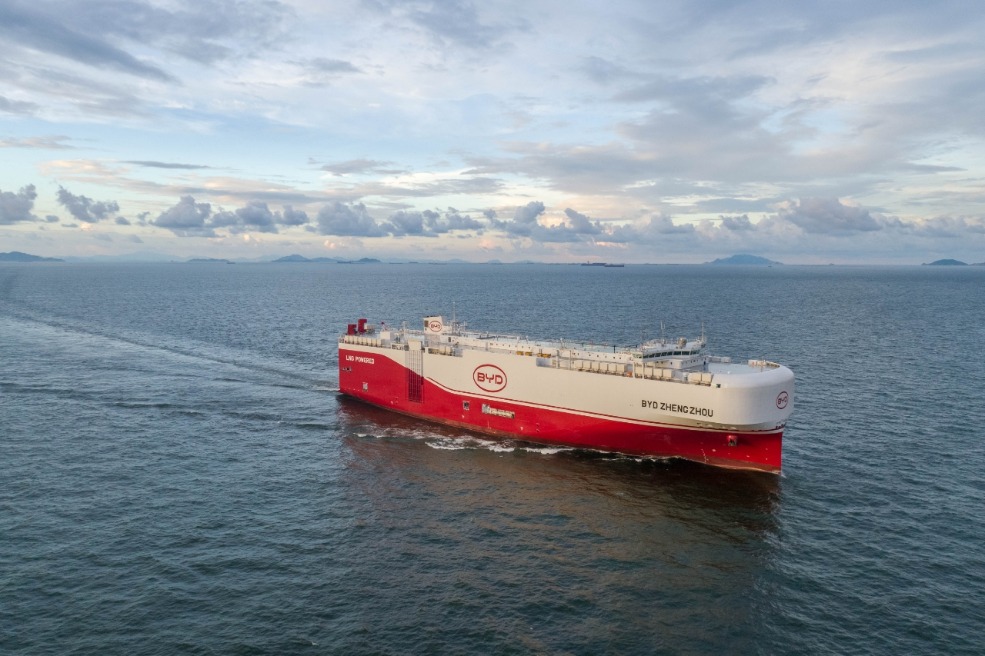
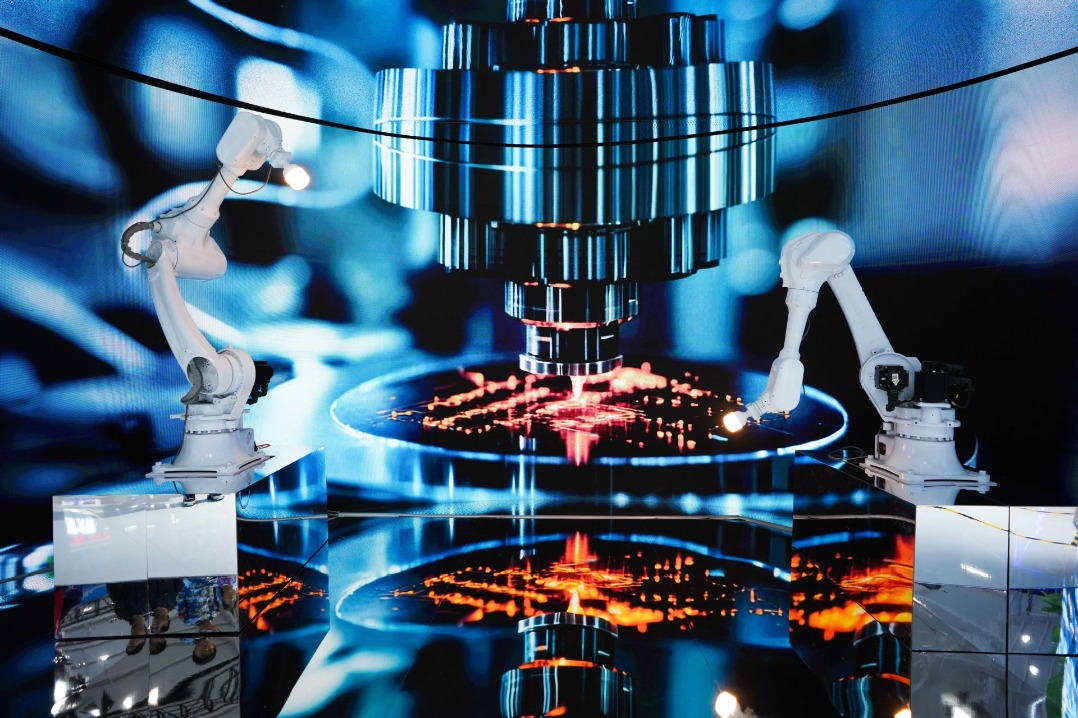
High-end, intelligent, and green production have become highlights of SSE companies, especially in the manufacturing sector.
The STAR Market has seen the flotation of over 120 high-end equipment companies, covering industries such as aerospace, industrial robots and laser processing.
The SSE's main board and STAR Market have seen the total market value of listed integrated circuit companies exceed 2 trillion yuan.
In 2023, the research and development expenses of entity companies listed in the SSE Shanghai exceeded 1.05 trillion yuan, up 6.44 percent year-on-year and accounting for nearly one-third of China's total R&D expenditure throughout the year. Among them, the R&D investment of STAR Market companies reached a new record of over 156.1 billion yuan, up 14.3 percent from a year earlier.
To further break down, the respective annual R&D expenditures of the building decoration, automobile, electronics, power equipment, pharmaceutical and biological industries all exceeded 80 billion yuan in 2023. The average five-year CAGR of R&D expenditure in the 13 monitored industries, including public utilities, communications, and transportation, all topped over 20 percent, according to the SSE report.